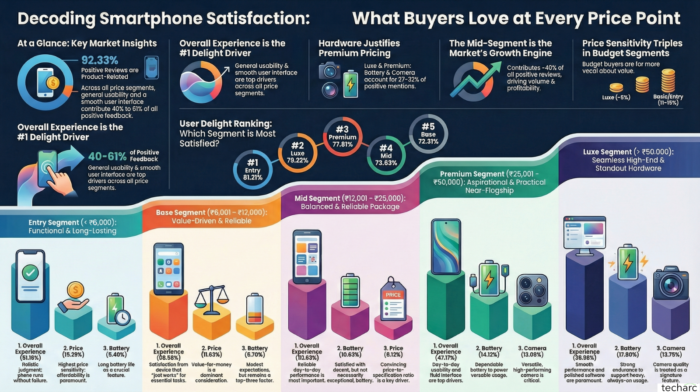
Techarc’s InsightsPro analysis examines 39426 positive 4–5-star smartphone ratings across major eCommerce platforms, segmented into five price bands. These reviews sit alongside an earlier InsightsPro study on negative feedback, which showed that dissatisfied users account for around 23% of total reviews.
In this positive-cohort analysis, overall experience emerges as the single biggest driver of satisfaction, contributing between 40% and 61% of positive feedback across all segments.

92.33% of customer reviews are product-related, while the remaining 7.67% are price-related. Regarding price, users predominantly describe the device as value for money, highlighting that it offers high quality and performance at a competitive cost.
1.0 Key Insights
- Overall experience dominates
Across all five segments, 40–61% of positive feedback are tagged under overall experience, making software stability, UI fluidity and day-to-day usability the primary reasons users award 4–5 stars.
- Hardware justifies premium pricing
In Luxe and Premium segments, battery and camera together account for roughly 27–32% of positive feeback, clearly differentiating higher-priced devices from mid and budget tiers.
- Mid segment is the growth engine
The mid segment (₹12,001–₹25,000) contributes close to 40% of all positive reviews, with strong overall experience scores, positioning it as the core volume and profitability driver for the market.
- Price sensitivity increases down the ladder
Price-related positives rise from about 5% in Luxe/Premium to 11–15% in Basic/Entry, indicating that budget buyers are roughly three times more price-sensitive and more vocal about value-for-money.
- Entry is under-penetrated but highly satisfied
Entry-level devices contribute only 0.65% of total positive reviews yet record the highest relative overall experience satisfaction at around 61%, signalling headroom to expand distribution and visibility in this band.
2.0 Most Delighted users Ranking (Segment Wise)
2.1 Luxe Segment
The Luxe segment records a strong user delight level, with 79.22% of users expressing satisfaction. This makes it the second-most delighted segment after the Entry segment. The high delight levels in this category suggest that premium experiences, superior product quality, and a focus on status-driven design resonate well with users who value aesthetics and exclusivity.
2.2 Premium Segment
The Premium segment follows closely behind, with 77.61% of users reporting delight. Although it ranks slightly lower than the Luxe segment, it still reflects a largely positive customer experience. The marginal dip indicates potential areas for enhancement.
2.3 Mid Segment
User delight in the Mid segment stands at 73.63%, making it one of the lower-ranked categories. This segment typically balances performance and pricing, attracting a mixed audience with diverse expectations. The lower delight score may stem from trade-offs between performance, design, and durability, suggesting room for better optimization or differentiation.
2.4 Base Segment
The Base segment records the lowest level of user delight at 72.31%. This reflects constraints commonly found in entry-level devices, such as limited features, average performance, and basic build quality. The data indicates that while affordability drives adoption, overall satisfaction remains modest, emphasizing the need for improved reliability and value perception to uplift the user experience.
2.5 Entry Segment
The Entry segment not surprisingly registers the highest delight level, with 81.21% of users reporting satisfaction. Since, this segment of users get first time view of digital life, their satisfaction always exceeds the expectations. This high rating points to strong perceived value for money, easy usability, and dependable basic performance. It also highlights how effectively this segment meets essential user expectations without overpromising, leading to higher overall delight.
3.0 What People Like Across Segments
3.1 Overall Experience
- Luxe: 39.96%
- Premium: 47.17%
- Mid: 52.63%
- Basic: 58.58%
- Entry: 61.18%
As price decreases, the share of overall experience increases. This indicates an inverse relationship between price and the relative weight of overall experience: users in lower bands have simpler expectations, and when the device reliably meets those expectations, satisfaction is strongly expressed.
3.2 Price (Value Consciousness)
- Luxe: 4.79%
- Premium: 5.61%
- Mid: 8.12%
- Basic: 11.63%
- Entry: 15.29%
Price becomes progressively more important in lower segments. Basic and entry users evaluate every feature through a value-for-money lens, making pricing strategy and communication critical in these tiers.
3.3 Battery
- Luxe: 17.80%
- Premium: 14.12%
- Mid: 10.63%
- Basic: 5.70%
- Entry: 5.49%
Battery is a key differentiator at the top end. Higher-paying users expect strong endurance to support heavy, always-on usage, and they notice and reward it in reviews.
3.4 Camera (Feature Richness)
- Luxe: 13.75%
- Premium: 13.05%
- Mid: 8.11%
- Basic: 4.20%
- Entry: 2.75%
Camera importance clearly declines as we move down price tiers. Premium and Luxe buyers treat camera performance as a signature feature, while entry and basic users largely treat it as a nice-to-have.
4.0 Segment-wise Insights
4.1 Luxe Segment (₹50,000 and above)
In the Luxe segment, 95.21% of the feedback is about product experience while just 4.79% is about price, indicating that users are largely satisfied with pricing and are more focused on how the device performs in everyday use.
Top three drivers in the luxe segment:
- Overall experience: 39.96%
- Battery: 17.80%
- Camera: 13.75%
Together, these account for 71.51%.
Luxe users are paying for a seamless, high-end experience. They strongly value smooth performance and polished software but also expect standout battery life and camera quality.
4.2 Premium Segment (₹25,001–₹50,000)
For the premium segment, the feedback is overwhelmingly dominated by the user experience. 94.39% of feedback centres on product performance and features, leaving just 5.61% focused on price.
Top three drivers in premium segment:
- Overall experience: 47.17%
- Battery: 14.12%
- Camera: 13.05%
Combined, these represent 74.34% of satisfaction drivers.
Premium buyers sit at the intersection of aspiration and practicality. They want near-flagship experience with dependable battery and versatile cameras.
4.3 Mid Segment (₹12,001–₹25,000) – Mass Market
The mid-segment has, 91.88% of the feedback is product-related, while 8.12% pertains to price.
Top three drivers in Mid Segment:
- Overall experience: 52.63%
- Battery: 10.63%
- Price: 8.12%
These together contribute 71.38% of positive feedback.
This is the volume engine of the market. Users demand a balanced package: reliable day-to-day performance, decent battery life and a convincing price-to-spec equation. Here, optimisation and value communication matter more than pushing any single spec to the extreme.
4.4 Base Segment (₹6,001–₹12,000)
In the base segment, 88.37% of consumer feedback focuses on the product, while 11.63% pertains to the price. Notably, this segment has the highest percentage of price-related feedback compared to luxe, premium and mid segment.
Top three drivers in the base segment:
- Overall experience: 58.58%
- Price: 11.63%
- Battery: 5.70%
Collectively, these form 75.91% of satisfaction drivers.
Base-segment buyers are strongly value-driven. They are satisfied when the device just works for essential use-cases at a fair price. Expectations on battery are modest; reliability and affordability dominate.
4.5 Entry Segment (Below ₹6,000)
The data for the entry segment reveals the highest level of price sensitivity in the market. While product feedback still dominates at 84.71%, the price-related feedback peaks at 15.29%. This is the highest percentage across all segments. For these users, budget constraints are rigid. The feedback is heavily focused on affordability, discounts, and whether the device is the absolute cheapest option available.
Top three drivers in the entry segment:
- Overall experience: 61.18%
- Price: 15.29%
- Battery: 5.4%
Together, these account for 81.87% of positive mentions.
The dominance of Overall Experience over specific feature discussions suggests that these users judge devices holistically based on usability, simply wanting a phone that runs without failure, rather than dissecting technical specs like camera sensors or refresh rates. With Battery (5%) emerging as a distinct priority, it highlights that for the entry-level demographic, a smartphone is a tool for daily survival; the priority is not innovation, but rather a functional, long-lasting device that delivers the maximum possible value for a limited budget.